Project Info
An application designed to create and administer surveys, as well as provide reports, for the Student Agency Improvement Community (SAIC) program at Carnegie. Utilizes the survey tool API and Google Datastore.
Backend: Google App Engine Python webapp2 jinja2 Google Datastore
Frontend: Bootstrap d3 FontAwesome
Project Description
The Student Agency Improvement Community (SAIC) program at Carnegie works with K-12 schools to promote students' sense of agency and ownership of their classroom environment as well as their own learning. To measure this, surveys are administered to students at semi-regular intervals during the school year. SAIC is a network of schools, each with their own sets of needs and ideas for improving their students' agency. Each school has numerous teachers that teach a variety of subjects. Because of all this, there isn't just one survey that all schools and all teachers can give their students. Science teachers will need surveys that address student agency in their science class. Math teachers will need math-specific surveys, and so on. Developing a custom survey with custom questions for every teacher would be a monumentous task, so we need a way to automate this. This is where the SAIC Portal came in.
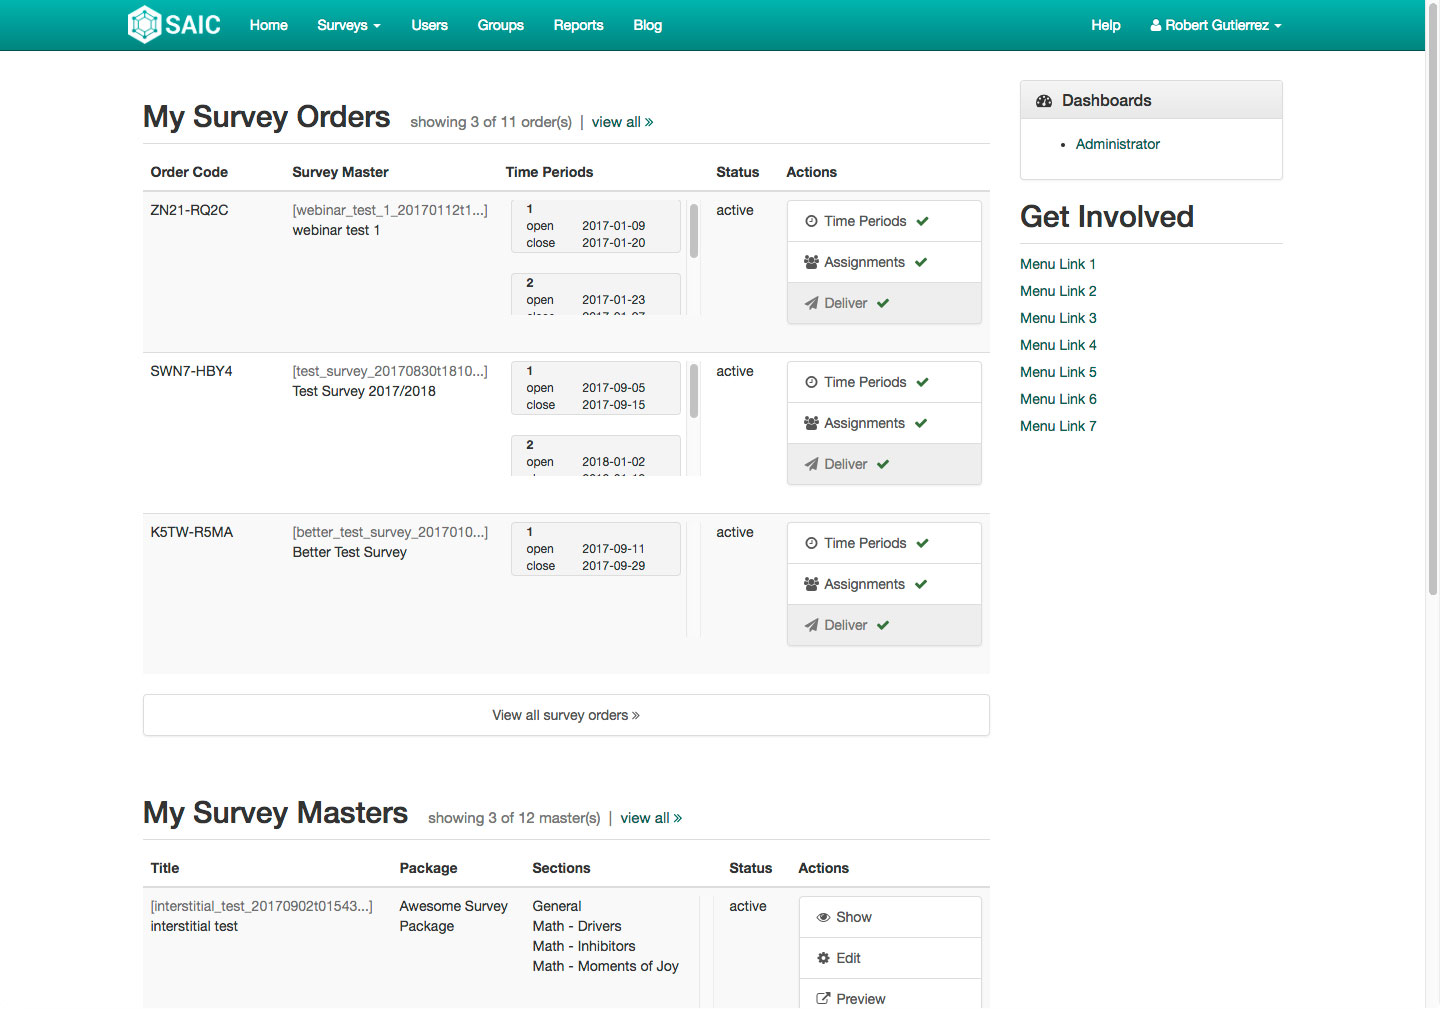
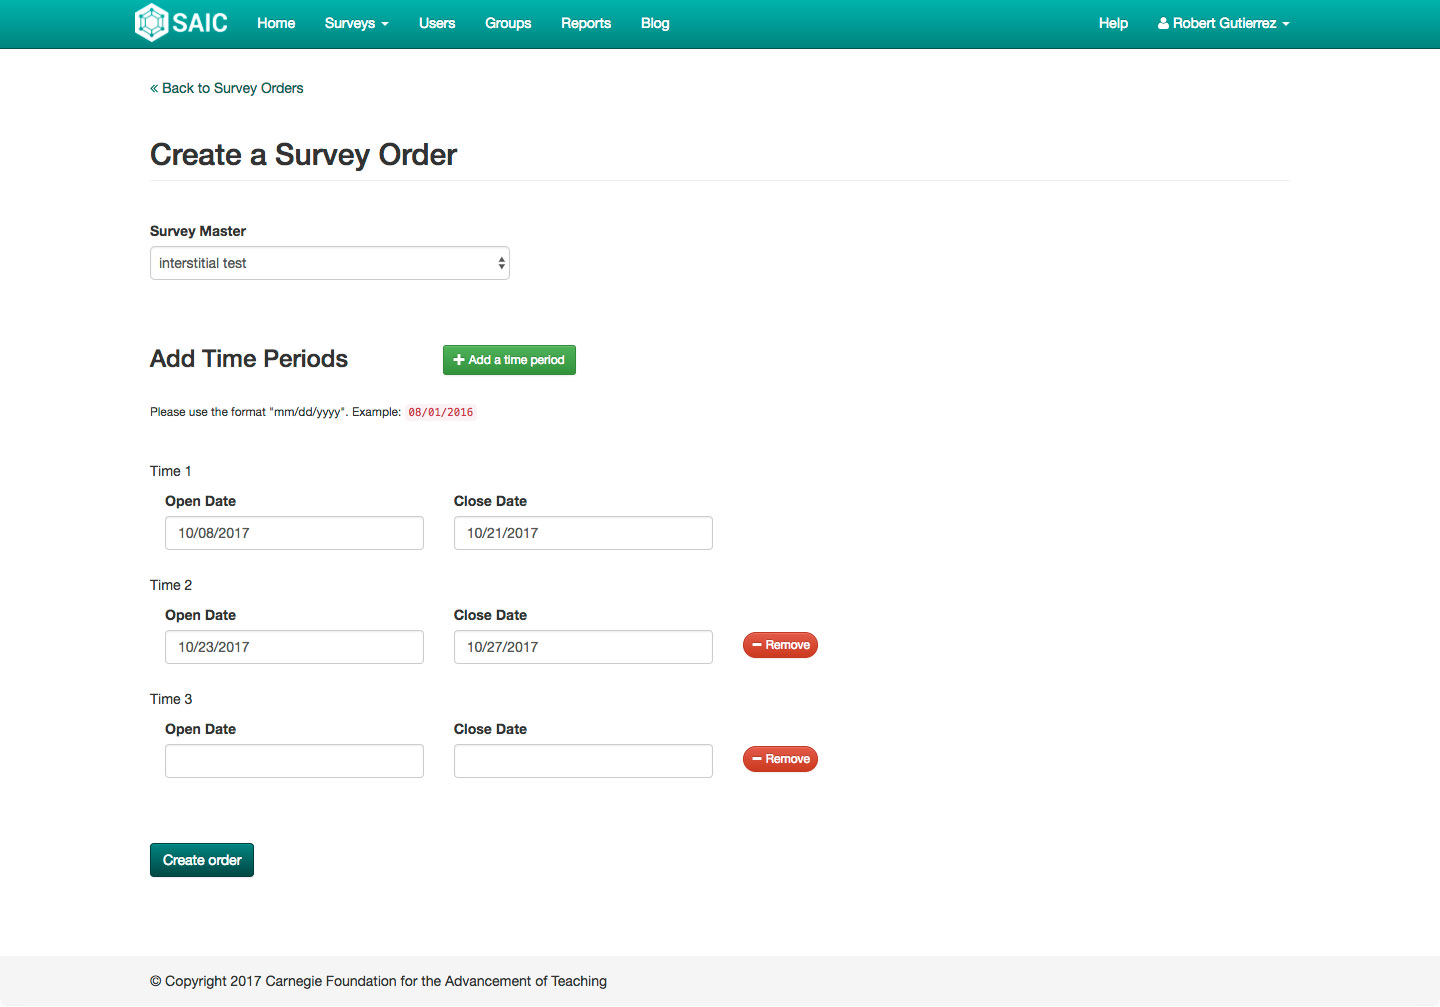
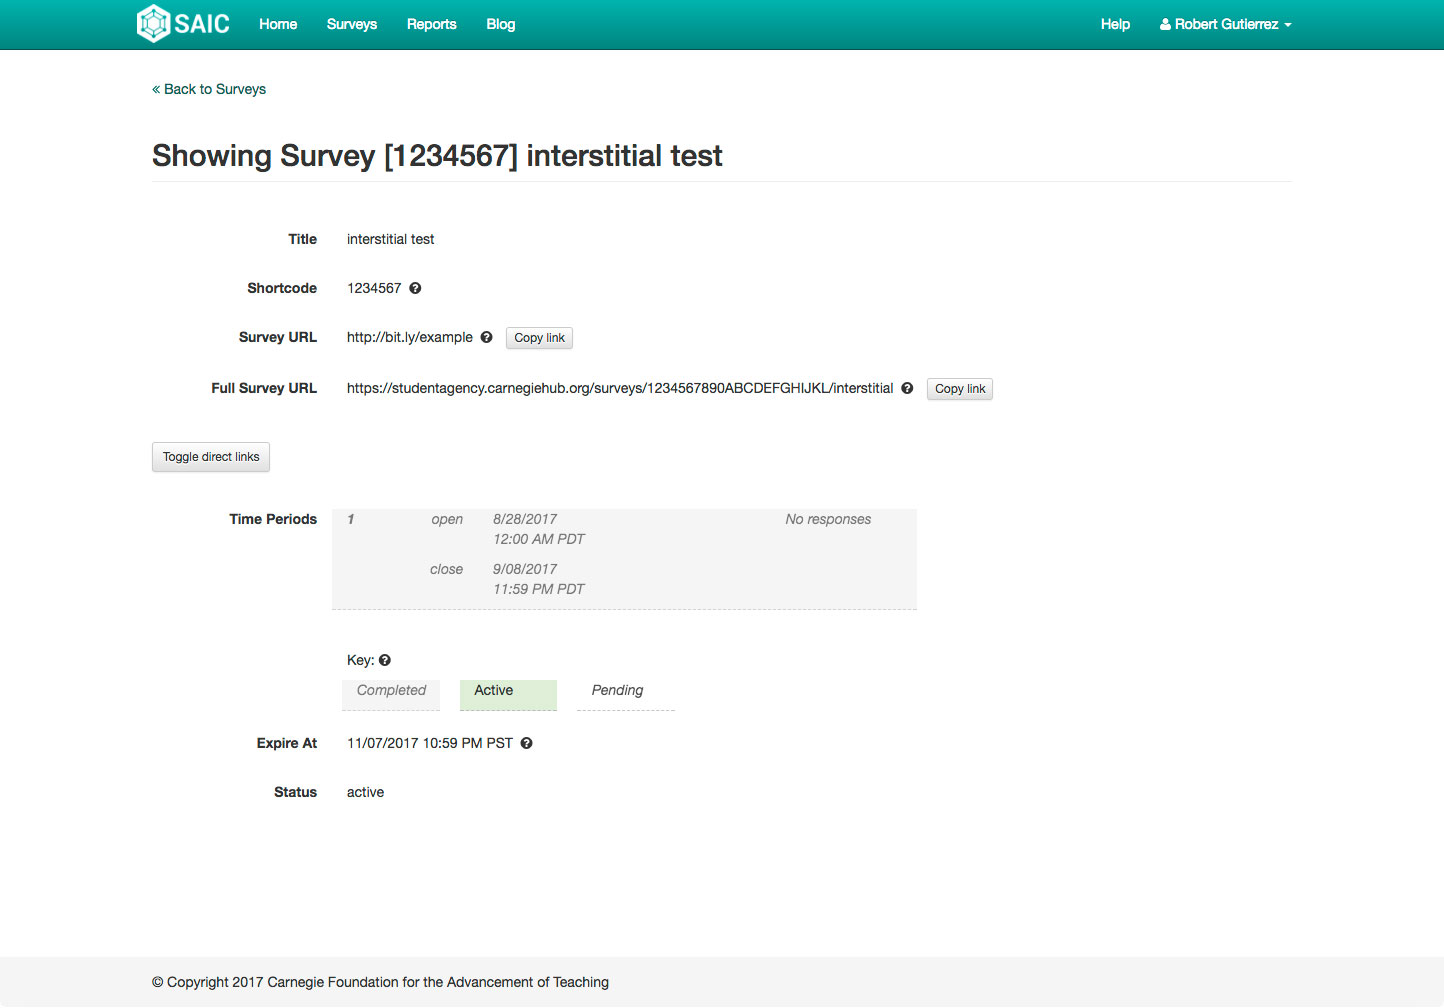
We needed to create a vast bank of survey questions and let our users pick and choose the ones they wanted for their survey. That way, the process could be automated. This is how "survey packages" were born. A survey package contains sections of survey questions along with some configuration options. Teachers can pick the sections they want and the system would provision a survey for them. Along with this, they can set time periods for when they wanted the survey to be open; students would not be able to access the survey between time periods. When a time period would end, a report would be generated automatically. The report matches students between time periods so teachers can see how their students' agency as changed over time. Because of our data agreements with our schools, and because the students are minors, the data is de-identified before it is presented to the teacher. The teacher can use the information from the report to improve their teaching and classroom environment.
Extensive testing was done on the application throughout 2016, but our first "pilot" happened in January 2017. After receiving feedback from teachers, a few modifications and updates were made, and another set of surveys were created for the 2017/2018 school year.
Backend
The data schema was a bit complex for this project, and this was the first time I wrote my own models for the Google Datastore. The schema ended up looking something like this:
Survey Package > Survey Master > Survey Order > Survey
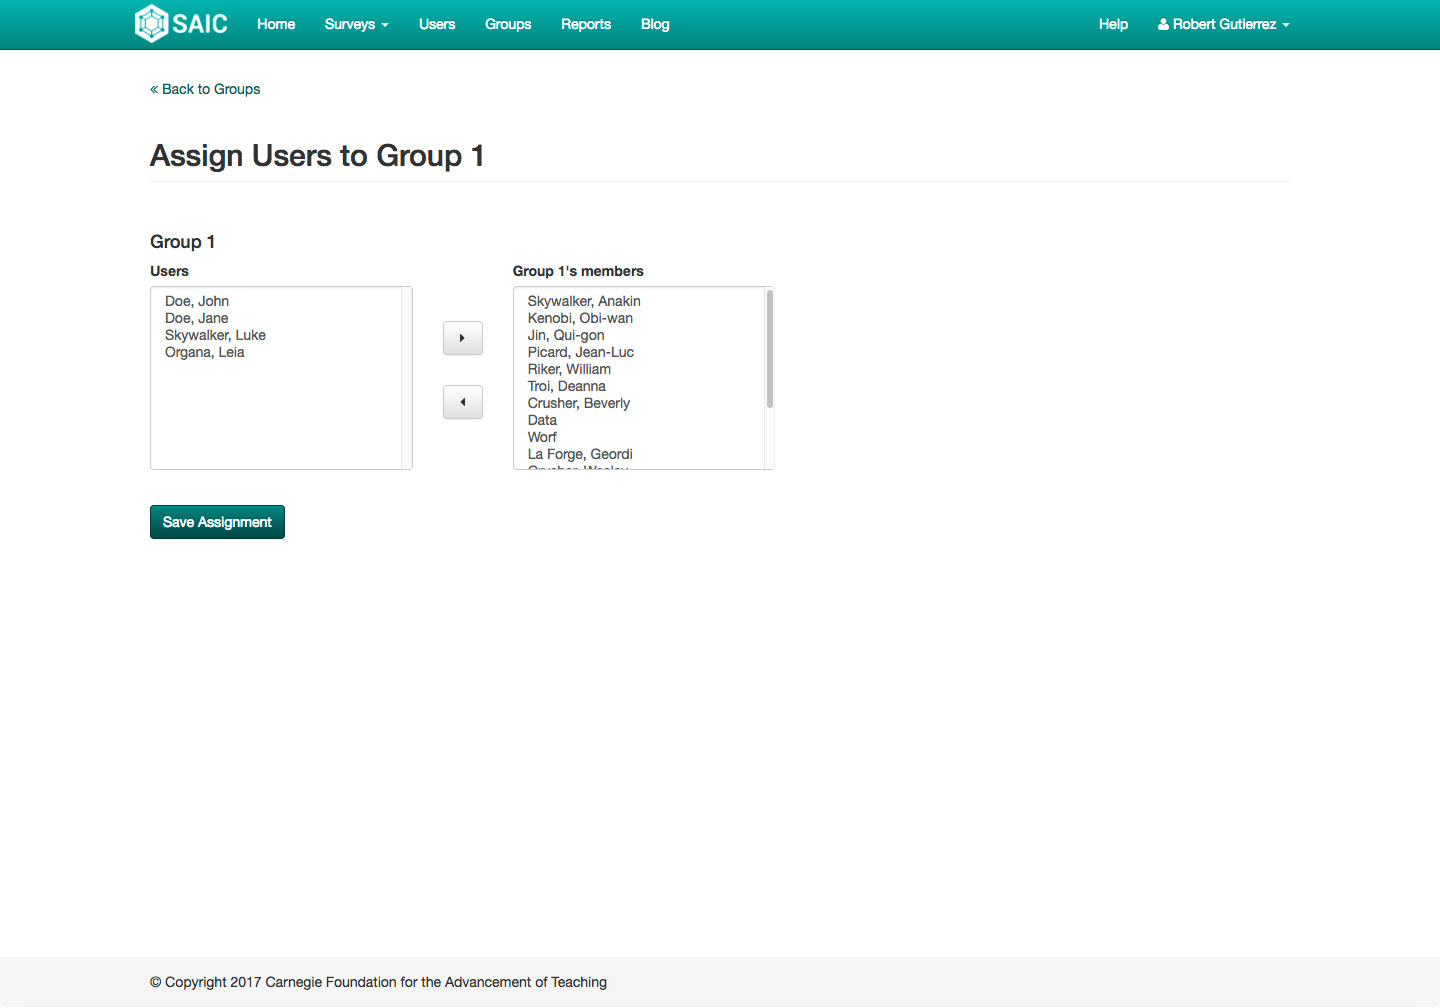
There are various other models involved as well like users and groups. But this is how we end up with a survey.
As far as the reports, I used the stock-and-flow code that we use in our Pathways Portal application. It underwent extensive modification due to the differences in the way surveys are administered. Data needed to be grouped into subjects, then measures, then submeasures. The way it generates the reports is mostly the same: the system queries the survey tool API for the data, groups the data, then maps the students' agency for each measure. The data is saved in JSON format, where it is read by the report template and parsed by d3 to create the data visualizations. The layout of the report can be seen in the screenshots at the top of the page.
Frontend
This application uses the same tech stack that our other applications use: Bootstrap, jQuery, d3 for data visualization.
Design Decisions
A lot of the hard work has already been done in our other applications, specifically our Pathways Portal application. Rather than re-invent the wheel, and to ensure consistency among our applications, I started with a "shell" of the CMP Portal and built everything from there. Because SAIC is a separate program from CMP, I needed to change the color scheme and logo. My colleague Kenneth Fernandez designed the new logo while I developed the new color scheme.


